It’s no secret that I have been fairly transparent at Belly Up about my feelings towards certain conferences when it comes to college football. I have called the Big Ten overrated, the SEC too good and even suggested what the Big 12 could have been without their terrible conference realignment decisions. Regardless of how that sounds or what the Belly Up audience – and staff – may think however, I remain unbiased.
To finally prove once and for all just how incredibly unbiased I am, I have constructed the definitive overall college football conference ranking. By collecting data from the past 5 seasons, I created 8 categories to determine who is superior. These categories combined performance, fan support and overall impact that the conferences have on football.
- Average Attendance
- Non-Conference P5 Record (Bowl Games Excluded)
- Bowl Records
- Number of Teams Ranked in Final AP Poll
- Playoff Appearances
- Championships
- Number of Appearances in a Top 10 Most Watched Game
- Number of NFL Draft Picks
Average Attendance
Based on these results, it’s fairly clear the SEC has the most dedicated fans. Over the past 5 seasons, the SEC has an average total difference of nearly 11,000 fans ahead of the next conference, the Big Ten. The biggest drop however is from the ACC to the American. Although the AAC is a fair amount ahead of the rest of the G5 conferences, there is clearly a separation that forms the Power 5. Only about 20,000 average fans more before that #P6 slogan becomes a reality, AAC. Almost there, sort of.
- SEC: 77,226
- Big Ten: 66,314
- Big 12: 57,458
- Pac-12: 51,064
- ACC: 49,375
- AAC: 30,329
- MWC: 24,557
- C-USA: 19,983
- Sun Belt: 17,919
- MAC: 15,633
Non-Conference P5 Record (Bowl Games Excluded)
I’m not going to lie, this one came as a bit of a surprise. I didn’t necessarily assume the SEC would win this category but I really didn’t think it would be the Pac-12. Nevertheless, the Pac-12 has a fairly incredible non-conference record against fellow P5 schools over the last half-decade. The ACC and the Big 12 are the only P5 conferences to have a losing record in fact.
The AAC once again acts as the mediator between the P5 and the G5. The American’s record in this category is actually fairly impressive considering it’s a G5 conference playing up to P5 competition. Looks like there is still plenty of quality options for a Big 12 expansion when they finally decide to add some teams and play with the other big boys again.
- Pac-12: 0.585
- Big Ten: 0.530
- SEC: 0.507
- ACC: 0.479
- Big 12: 0.400
- AAC: 0.315
- MAC: 0.180
- MWC: 0.171
- CUSA: 0.071
- Sun Belt: 0.056
Bowl Records
You might need to sit down for this one; the Sun Belt won a category. I was weary to include this category to begin with but I knew someone would rage message me if I didn’t so here you go angry messenger. The Sun Belt has the best bowl record over the past 5 years, are you happy? Take this category with a grain of salt however.
The arguments about the players not being mentally invested or losing seniors and coaches prior to a bowl aside, better conferences tend to get stuck with the toughest bowls. The AAC for instance is constantly playing up so they consistently get tougher bowl opponents for the best teams. Whereas, the Sun Belt will only have a few of their most competitive programs compete each year, usually against a MAC or lesser AAC opponent. I’m not trying to completely discount bowl records but I personally don’t think they are a great measure of success in college football.
- Sun Belt: 0.609
- SEC: 0.552
- Big Ten: 0.541
- MWC: 0.515
- Big 12: 0.514
- ACC: 0.500
- CUSA: 0.458
- Pac-12: 0.450
- AAC: 0.353
- MAC: 0.241
Number of Teams Ranked in Final AP Poll
Yet another category to further inforce the P5 dogma. You could argue that the AAC is suffering systematic discrimination on the basis of a predetermined bias linked to elitist blue-blood program influences but that may be a stretch. The fact of the matter is, this category isn’t necessarily based on wins and losses or analytical data like the others. The Associated Press poll is a ranking determined by fellow football fans. Regardless, it’s a fairly telling category that shouldn’t be so quickly overlooked.
- SEC: 27
- Big Ten: 23
- Pac-12: 20
- ACC: 18
- Big 12: 16
- AAC: 9
- MWC: 6
- CUSA: 2
- MAC: 1
- Sun Belt: 0
Playoff Appearances
If you think conference bias and anti-G5 mentalities influenced the last category, this one is sure to trigger your fragile sensibilities. The current FBS playoff system receives plenty of flak – from myself included – but that doesn’t mean the accomplishment of appearing in a playoff should be ignored. After 5 seasons of existence, every P5 conference has competing in the playoffs at least twice. Don’t remind the AAC fans of that however.
- SEC: 6
- ACC: 5
- Big Ten: 3 / Big 12: 3
- Pac-12: 2
Championships
While we are on the topic of triggering certain fans, this category lists the conferences by the number of championships over the past 5 seasons. If you noticed that I didn’t include the AAC that’s because like UCF, I personally made the decision to not recognize their made-up championship in the Peach Bowl. Nevertheless, winning a championship is a major accomplishment and it shows the level of competitiveness among certain conferences.
- SEC: 2 / ACC: 2
- Big Ten: 1
Number of Appearances in a Top 10 Most Watched Game
Similar to the average attendance, this category is meant to measure the fan base, support and pure draw a conference has of an audience. Although attendance is a great measure of fan support, it doesn’t fairly represent the entire fan base that is unable to attend games or the amount of interest in a program by outside viewers. By taking the top 10 most watched college football games over the past 5 seasons, I tallied every time a team from a certain conference was featured.
If you’re interested in the order of most watched schools it goes: Alabama by nearly double, then Ohio State, Clemson, three-way tie between Michigan, Oklahoma and Georgia, tie between LSU and Auburn, and a tie for 6th between Notre Dame and Texas.
- SEC: 38
- Big Ten: 28
- ACC: 15
- Big 12: 9
- Pac-12: 7
Number of NFL Draft Picks
For the final category I chose to compare conferences based on their ability to transition players to the professional level and who the NFL tends to trust when it comes to finding talent. Once again, this is another category that flexes the SEC’s dominance as well as further cementing the G5 to P5 gap. Over the past 5 seasons, the SEC has contributed far more players to the NFL than any other conference and to be honest, the numbers don’t change much if you expand the length to the last 10 years.
- SEC: 260
- ACC: 203
- Big Ten: 180
- Pac-12: 171
- Big 12: 112
- AAC: 66
- MWC: 52
- CUSA: 44
- MAC: 36
- Sun Belt: 19
Conclusion
I don’t like being the guy that has to say I told you so. So instead, I’ll be the guy that shows you so. If you add up the scores based on where each conference placed in every category, the SEC is still honestly too good. I mean, just look at what the SEC dominates at; NFL draft picks, most watched games, championships, playoff appearances, fan attendance and number of post-season ranked teams.
- SEC: 11
- Big Ten: 19
- ACC: 27
- Pac-12: 31
- Big 12: 33
- AAC: 47 / MWC: 47
- CUSA: 54 / Sun Belt: 54
- MAC: 59
One unexpected thing this project made very clear to me was the definitive boundary of the P5 conferences and the G5 conferences. In nearly every category, there was an apparent drop after the first 5 conferences that I honestly didn’t expect to be so drastic. Just out of curiosity, I decided to run the numbers of every category for a hypothetical realignment that would combined some of the top G5 competition to see if it’s possible to create a true P6 conference with the remaining teams.
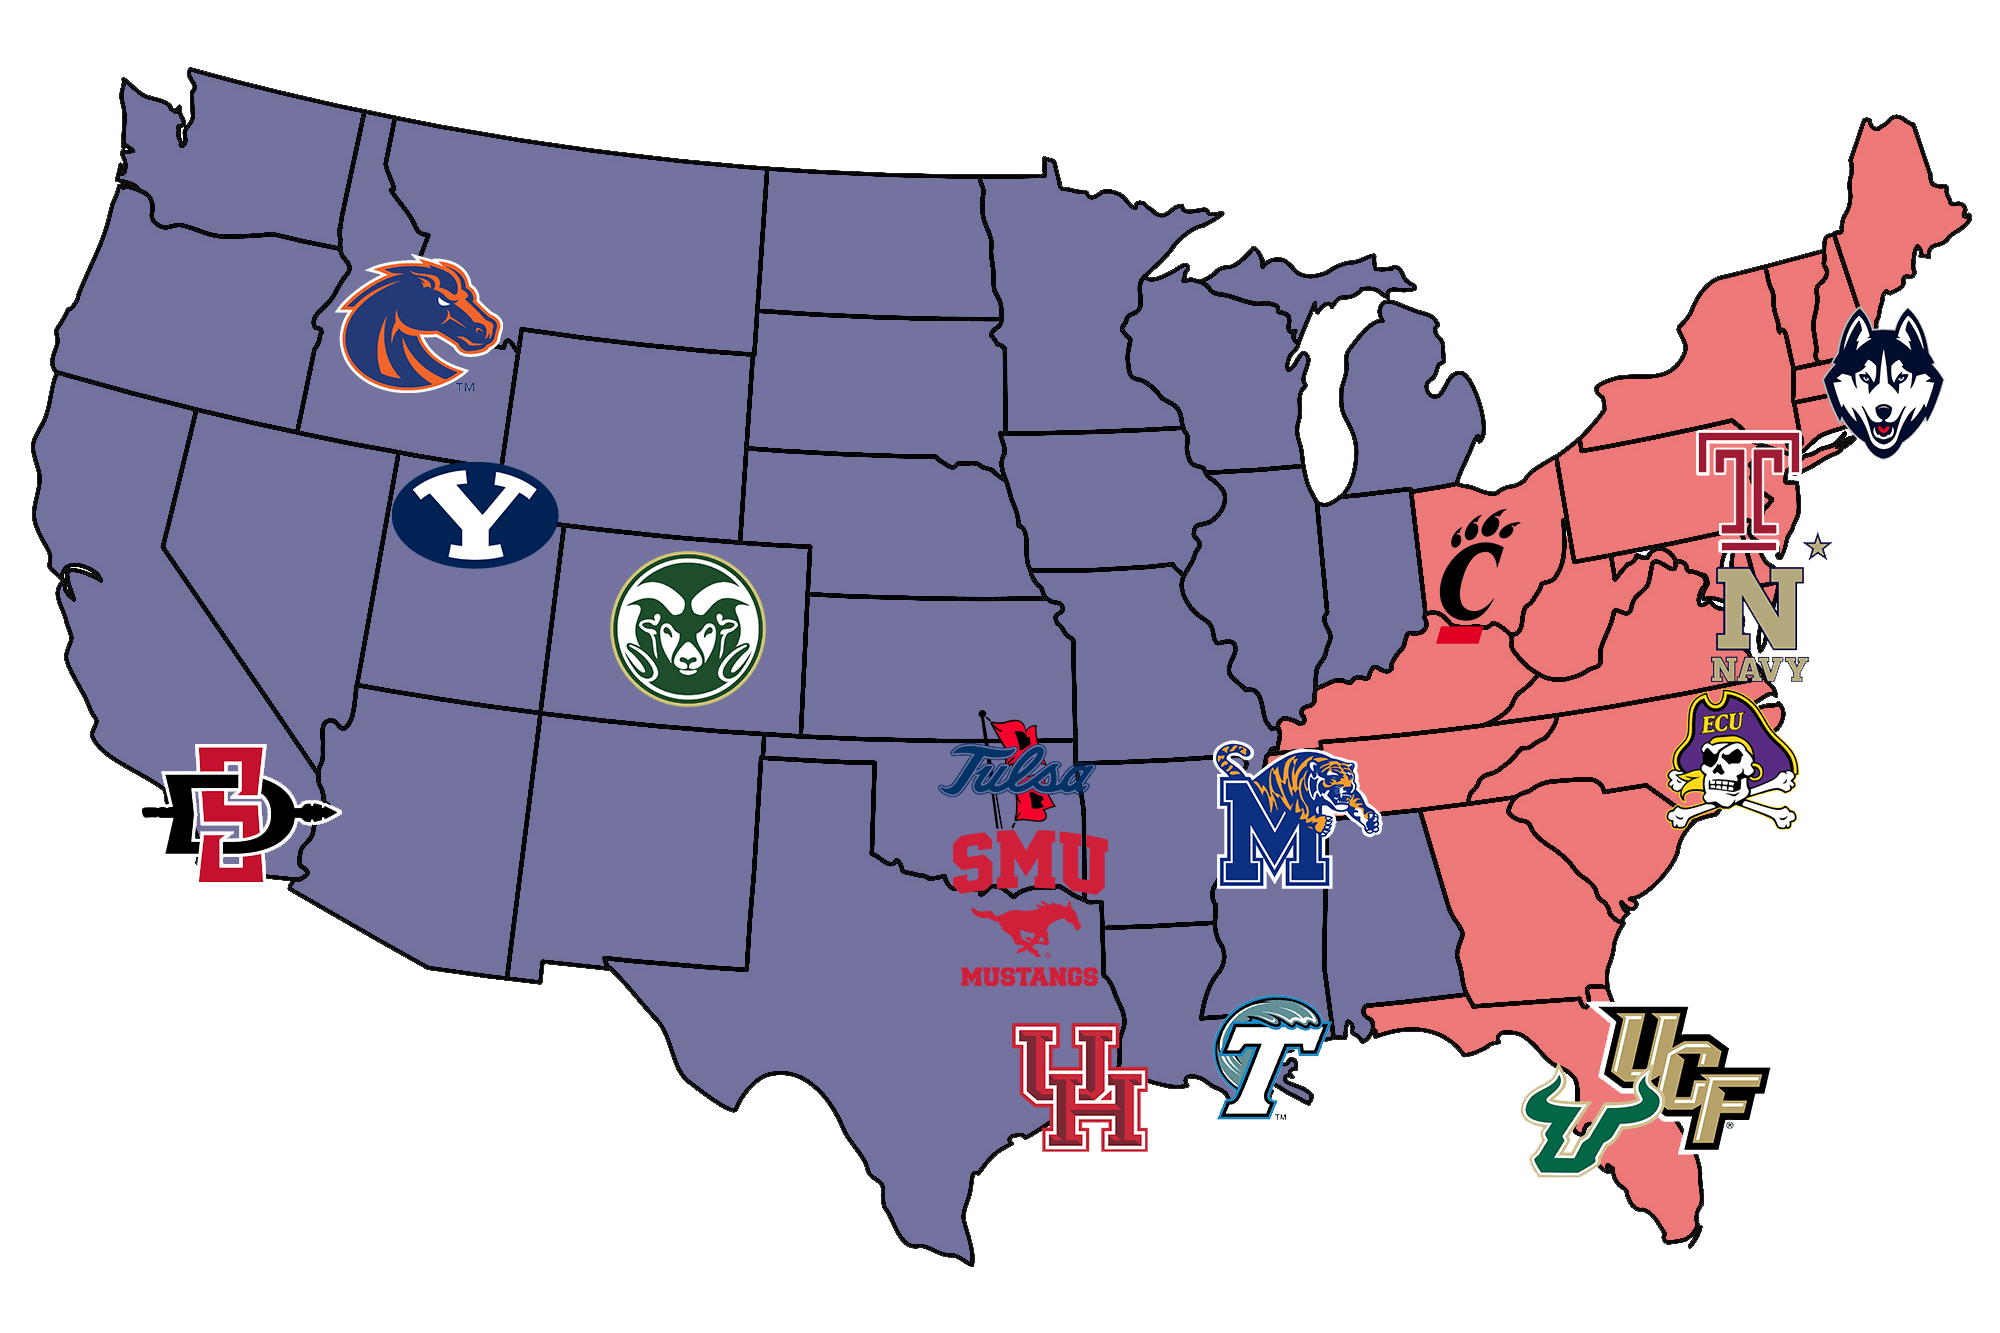
P6 Conference
[one_half padding=”20px 20px 20px 20px”]
West
- Houston
- SMU
- Tulsa
- Tulane
- Boise State (MWC)
- SDSU (MWC)
- Colorado State (MWC)
- BYU (Independent)
[/one_half][one_half_last padding=”20px 20px 20px 20px”]
East
- Cincinnati
- UConn
- ECU
- Temple
- UCF
- USF
- Navy (West)
- Memphis (West)
[/one_half_last]
In my previous AAC Expansion article, I created a hypothetical conference based on a merger with the Mountain West. By attempting to realistically combined the best teams from both conferences – as well as BYU – I felt this conference would have the best chance of finally create the ever-elusive and mysterious P6. Based on this ranking, we should be able to find out if this is truly a P6 conference or just another failed attempt to please to Associated Press
- Average Attendance: 32,184
- Non-Conference P5 Record (Bowl Games Excluded): 0.338
- Bowl Records: 0.356
- Number of Teams Ranked in Final AP Poll: 12
- Number of NFL Draft Picks: 95
In terms of attendance, this hypothetical conference sees just a slight increase from the current AAC, yet remains 17,000 behind the ACC – the lowest of the P5. Where it makes the best argument as a P6 conference is in the P5 record, teams ranked in final AP Poll and NFL draft picks. In all three of those categories, this conference drastically closes the gap and although still behind any P5, they are closer to the P5 conferences then to any other G5.
Unfortunately, this conference’s lack of playoff appearances, championships and most watched game appearances drastically hurts their argument as a true P6. It could be argued that the increased level of competition would eventually lead to appearances in the playoffs as well as most watched games but for the time being, this is purely speculative. At this point and time, there is clearly only 5 Power conferences and the SEC is definitively the best.